
Industry Surveys
CGarchitect 2009 Industry Survey Results - Spotlight on the Future of the Architectural Visualization Industry
CGarchitect 2009 Industry Survey Results - Spotlight on the Future of the Architectural Visualization Industry
Jeff Mottle - CGarchitect.com
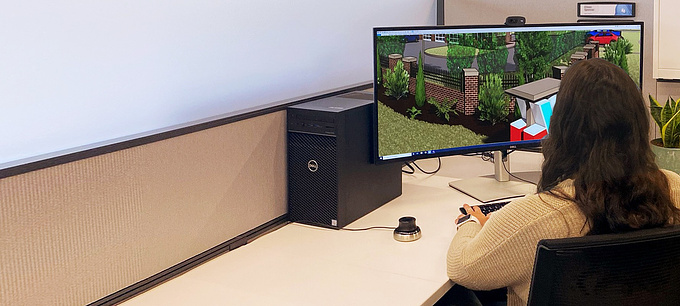
Earlier this year we conducted our third worldwide industry survey to help determine the current state of the field and how the current economy has impacted businesses. Our last survey was conducted in 2006. The survey this year was taken by almost 3,000 respondents and provided some very insightful information about where things are headed.
Those of you who subscribe to 3D World magazine will have seen our preliminary analysis in issue #120 (September 2009). In that report the findings pointed to a field that was not as badly affected as many had thought. Since that article we have received additional information that we will present here along with our forecast for the next 2-3 years.
By all accounts our industry has undergone a radical change in the last 12 months that has seen a dramatic drop in sales, layoffs and a number of companies who have closed their doors. Certainly none of this is good, but based on the early results of our survey, only about 20% of our industry was hit the hardest. This is not to say the worldwide recession has not impacted every facet of the industry, however the vast majority are continuing to do business and in some cases were even growing their businesses.
Most companies were impacted by reduced sales in the October 2008 to May 2009 time frame, however there was a second wave who were not affected until early to mid summer 2009. This second wave was comprised mostly of larger boutique companies and architectural firms who had long term projects still in the pipeline or receivables that were still coming in from projects completed in late 2008 and early 2009. Once those dried up, they too were hit with forced cutbacks and a reduction in sales.
As this year's survey closed in June 2009, we only just started to gather data on this second wave before the survey closed. To help shed light on how this impacted our results we launched a smaller economic indicator survey that specifically examined gross sales, volume of work and volume of RFPs (Requests for Proposals). While early results were not very positive, August saw the first signs of recovery with most companies indicating growth in all three areas.
The remainder of this report will focus on a few select results from the over 100 questions posed in the two surveys. Although our survey data can be segmented by country and company type, unless otherwise noted the data presented here represents answers provided by respondents from all over the world and all types of companies ranging from Architectural firms to visualization companies and manufacturers. The vast majority of the data came from in-house visualization departments at architectural firms and visualization companies and freelancers.
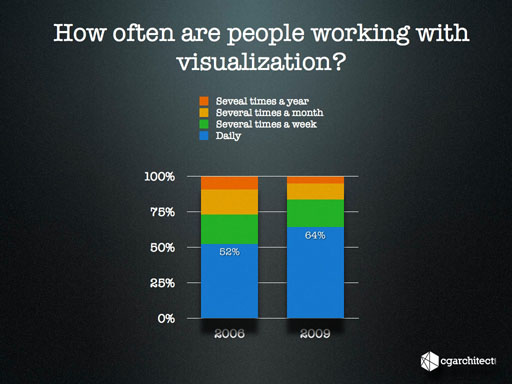
Figure 1: How often are people working with visualization?
Compared to our last survey in 2006 there was a 12% increase in the number of people who started using visualization on a daily basis. This points to the growth our field saw in the last 3 years in the demand and requirement for visualization in many facets of the architectural field.

Figure 2 - What types of projects are being visualized?
The types of projects being visualized did not change a lot since 2006, but I thought it was interesting to showcase the range of fields where architectural visualization are being created. As expected commercial and residential accounted for the vast majority of work being created.
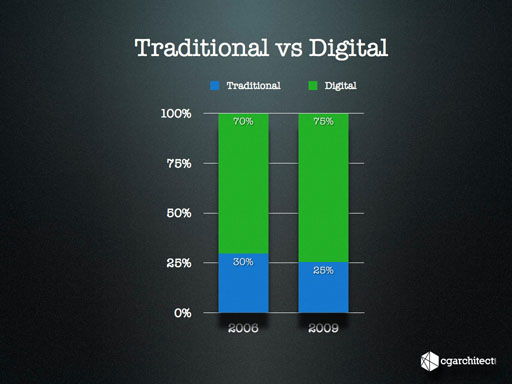
Figure 3 - Traditional vs. Digital
I created this graphic for a presentation I recently did for the ASAI (American Society of Architectural Illustrators,) as they are comprised of about 50% traditional illustrators. I thought I would include it here as it points quite heavily to the continued demand for these types of artists. From 2006 to 2009 we saw some of the largest growth our industry has seen. To see only a 5% decrease in the amount of traditional work during this boom is telling that its demand is not likely to decrease a lot in the coming years.

Figure 4 - Where are clients based?
Figure 4 is a very telling indicator of a widespread problem in our industry. In an increasingly global economy it becomes very important to diversify the location of your client base if you wish to survive recessions or the changing face of our industry. Fifty five percent of respondents indicated their clients were based in the same city or country. The companies that are doing the best right now are the ones who had the foresight to diversity both their client locations as well as the types of work they are doing for those clients. When you are too heavily invested in local clients, your are much more susceptible to very large swings in revenue when individual clients change their spending habits and/or when there is a local change in economy. Just as you would diversify your investment portfolios, so should you your client base.

Figure 5 - Architectural Still Image Variable Fees
Figures 5 and 6 show the average fees being charged around the world for still images and animations. To my knowledge this is the first time in our industry that this type of data has ever been collected. As you can see from the graph above the majority of companies charge $2,000 USD or less for a single image. Asian countries are often criticized for offering their services for below market averages, but to be fair South America, Eastern Europe and Asia are all on an even playing ground. For better or worse this shows how globalization has affected our industry as it has many others in the past.

Figure 6 - Architectural Animation Variable Fees
The results for average animation fees were very similar to the still images and showed that most companies charge less than $10,000 for an animation. Interestingly Australia came in higher than most. I have been anecdotally told this is likely due to the lack of companies that can deliver them and the lesser demand for animations in Australia.

Figure 7 - Interesting Software Usage Changes
While the survey this year and in 2006 allowed respondents to choose from a wide range of modeling and rendering software, I've extracted some of the more interesting changes in the last three years. There was a 15% increase in the number of 3ds Max users, which could be explained by the discontinuation of Autodesk VIZ, but at 83% usage, shows it's by far the most used software in the architectural visualization field. Revit usage grew by 10%, but is still a lot lower than I would expect based on the marketing that Autodesk pours into Revit each year. While I am pretty confident that Revit will eventually replace CAD as CAD replaced the drafting board, these numbers do seem to point to a slower than expected adoption rate. The rendering engine usage shows some of the most dramatic changes. When third party rendering engines first hit the market V-Ray, Brazil and Final Render all stood a reasonably good chance of becoming the market leader, but Chaos Group's early decision to offer a free version of their software helped cement them as the market leader. Brazil was gaining traction early on, but they decided to focus their energies on the entertainment market and all but stopped marketing to the architectural industry. They have since been acquired by Caustic graphics. As you can see from Figure 7 V-Ray jumped 24% in usage in our industry, while Brazil and Final Render each saw a 5% decrease. mental images also gained some ground with an 8% increase. I expect mental images to increase a lot more in the next 3 years as budgets for third party engines decrease coupled with the drastic improvement in the 3ds Max implementation of mental ray in terms of ease of use and rendering speed.

Figure 8 - How secure are people about their positions or company?
In light of the economy we asked survey takers this year how secure they felt about their positions if they were an employee or about their company if they were an owner. The results point to a very optimistic industry with 75% indicating that they were either very secure or somewhat secure with the direction things are headed.

Figure 9 - Lost jobs due to below market average bids.
The results from figure 9 were somewhat eluded to earlier in this survey by the average industry pricing, so it was no surprise to see that 45% of our industry has lost work to companies or individuals who are charging below market average. An unfortunate side effect of a global economy, but a reality never the less.

Figure 10 - Which deliverables do you outsource?
About 40% of respondents this year indicated they outsource work. Although there was not a significant change in what was outsourced in the last three years, what did change was the reason for outsourcing. In 2006 most indicated they outsourced due to a lack of bandwidth, however that has now shifted to cost savings. Of those who do outsource, only 25% or less of their total work is put out for bid.

Figure 11 - Staffing Levels (Last 12 months)
The next three charts (Figures 11 to 13) show changes in staffing levels. Figure 11 shows the changes experienced in our industry from June 2008 to June 2009, which was the time frame covering the largest changes to the field. The US was hit much less severely than the worldwide averag,e with 39% of companies indicating they had to make staff redundant. Sixty percent kept staffing levels the same or hired in the last 12 months. Asia was the hardest hit by the recession showing 67% of companies who were forced to let staff go.

Figure 12- Staffing Levels (Next 12 months)
Staffing levels through to June 2010 are looking a lot more optimistic with the majority of companies indicating that they will be maintaining current staffing levels or hiring staff.

Figure 13 - Staffing Levels (Next 24 months)
The increased optimism continues into June 2011 with most companies indicating they expect to begin hiring again in the next 24 months. Asia remains the least optimistic with 31% still looking to downsize even 2 years from now. A testament to the severity of the difficulties they are experiencing now.
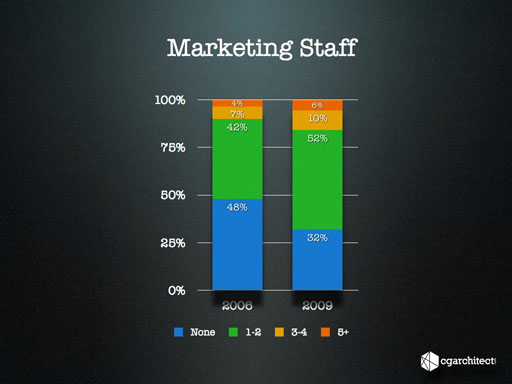
Figure 14 - Marketing Staff
The maturation of our industry in the last three years revealed itself through a 16% increase in the number of companies who have hired dedicated marketing staff. I certainly envision this may have decreased slightly with some companies who had to make staff cutbacks, but points to the importance of a dedicated sales force once your company reaches a certain size.

Figure 15 - Which marketing is most effective?
In a market where staying in visible to your current and potential clients is a reality, advertising becomes critically important. Even the best client relationships can fall prey to cost cutting. Marketing is a fantastic way to remind your clients why they should be working with you and the value of your services. Word of mouth referrals toped the survey with 85% indicating that it was the most effective medium in securing new business. Personal contact via email and industry partnerships secured second and third place. Although most prefer not to engage new clients with less favorable cold call, 35% indicated it does work. Interestingly some of the most costly marketing methods were also some of the least effective, which is something to consider when you review your marketing budget for 2010.

Figure 16 - Industry Growth
The optimism in the industry is further reiterated with 46% of survey takers indicating they felt they would see very strong or strong growth in the current economy. Only 22% felt it would be diminishing or entering a recession, despite 64% having seen a decrease in the volume of their work.

Figure 17 - The next 2 years...
This year we asked respondents to indicated which statements they agreed with, relating to the makeup of the industry. Sixty percent felt there would be an increase in the number of freelancers and a 46% predict and increase in the number of in-house departments. The increase in the number of freelancers can already be seen in the industry, and is a direct result of the staff that was let go in the last 12 months. I don't think we are seeing a growth in in-house departments just yet, but as architectural firms look to cost savings they will likely increase their in-house teams. For the foreseeable future these departments are likely to be made up of the few remaining visualization staff members and other staff members who will be tasked with creating visualizations. The increase in the number of requests for training in the industry by architectural firms, points firmly that less experienced staff members are now being assigned visualization responsibilities.

Figure 18 - Economic Indicator (Worldwide)
Figures 18 through 20 are a summary of the results from the follow up survey we ran from June to August 2009. As I mentioned earlier we asked the community to let us know how their RFPs, Gross Sales and Work Volume changed from month to month. These charts show the percentage of people who indicated they saw a decrease, increase or no change in each of these areas. It's important to note that this is not an measurement of the overall change in the industry, but rather the number of people who indicated they saw a change in each area. Figure 18 shows the worldwide trend. While not a huge increase it does appear that we are just starting to see a recovery in the industry. This is evident by not only an increase in each area, but the larger increase in RFPs vs Gross Sales. This latter metric points to projects that have just been commissioned in August, but are still in the accounts receivable pile. There still are about 30-40% who indicated a decrease , but that number is dropping. We're not out of the woods yet, but it does appear that things are going to start getting better. While speaking at the ASAI conference last week (October 2009), the group almost unanimously agreed that they had seen an increase in work in the last three months, so this was further confirmation of the survey results.
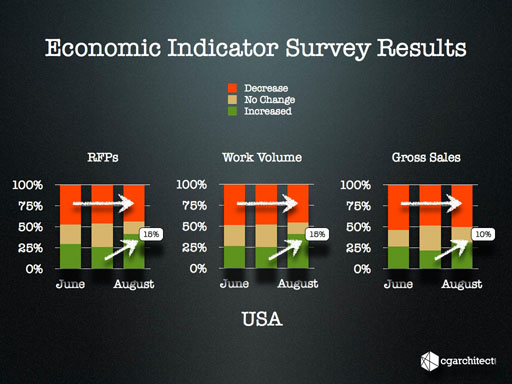
Figure 19 - Economic Indicator Survey Results (USA)
The results shown in Figure 19 are a lot more definitive in the increase in business that started in August. An jump of 15% in the number of people who saw an increase in RFPs and Work Volume brought the total to approximately 40% who did see an increase. Unlike the worldwide average results, the number of people who are still seeing a decrease looks to be holding, but not increasing.

Figure 20 - Economic Indicator Survey Results (UK)
The UK results in Figure 20 seem to point to a much earlier beginning to their recovery. RFPs and Work Volume dropped only slightly, but there was a large increase of 35% in Gross Sales bringing the total number of people indicating an increase to about 60%. This large Gross Sales increase suggests that work was completed at least 30 days earlier and was paid in August. The large drop in the number of people experiencing a decrease also fell in all areas, further suggesting the UK recovery is well underway.
The Future of the industry
The last 12 months has seen a drop in business unlike anything our industry has ever experienced in the past. It has affected almost everyone to some degree and will have lasting impact on the field, but I personally feel that the long term effects will have a more positive impact than negative. I equate the rapid growth and over abundance of work that coursed through our industry in the last four years, to the dot com growth that occurred in the late 90's and early 2000's. We saw an unprecedented increase in both the volume of work and the sheer number of people entering the industry. This level of growth was unsustainable and the global recession for all intents has acted as a "reset" button pushing us to pre-boom levels. Those who will recover and stay the course will be the companies and individuals who are both savvy in business and have the talent to separate themselves from the masses. I would hazard a guess that these companies will be better off in the long term as they will be more diversified in the type of work they do and better positioned to grow more organically with the industry.
The bottom line is that there will always be a requirement for architectural visualization and our industry will fare just fine. Will the face of our industry change, yes. Will we be the better for it, I think so. A recovery is well underway and I think there are still a lot more exciting times ahead.
If you would like to access the raw results from both of these surveys, head over to our forums HERE. You will need to be a registered member of our forums in order to access this link.
If you would like to post comments or questions about this review, please visit our forum
You must be logged in to post a comment. Login here.

Carlo NARDUCCI
Report Abuse
6 years ago

Aldo Garcia
Report Abuse
Great!
About this article
At long last the results from our 2009 Architectural visualization industry survey and economic indicator surveys are here.
visibility28.2 k
favorite_border5
mode_comment2