


Industry Surveys
2020 Architectural Visualization Rendering Engine Survey Results
Image Credit: Artur Adamczyk / Arcaded house
The 2020 Architectural Visualization Rendering Survey is an update from our 2019 survey
Responses were gathered between June 25, 2020 and September 11, 2020 via CGarchitect’s community (social media & email newsletter) and through Facebook groups and software forums associated with real-time engines and architectural visualization. A total of 2,529 responses were received collectively through all of channels.
For the purposes of Margin of Error calculations and market calculations, we are assuming a total market size of 150,000 people that are involved specifically in AEC visualization/rendering. Unless otherwise noted, the results have a Margin of Error of +/- 2% with a Confidence Level of 95%.
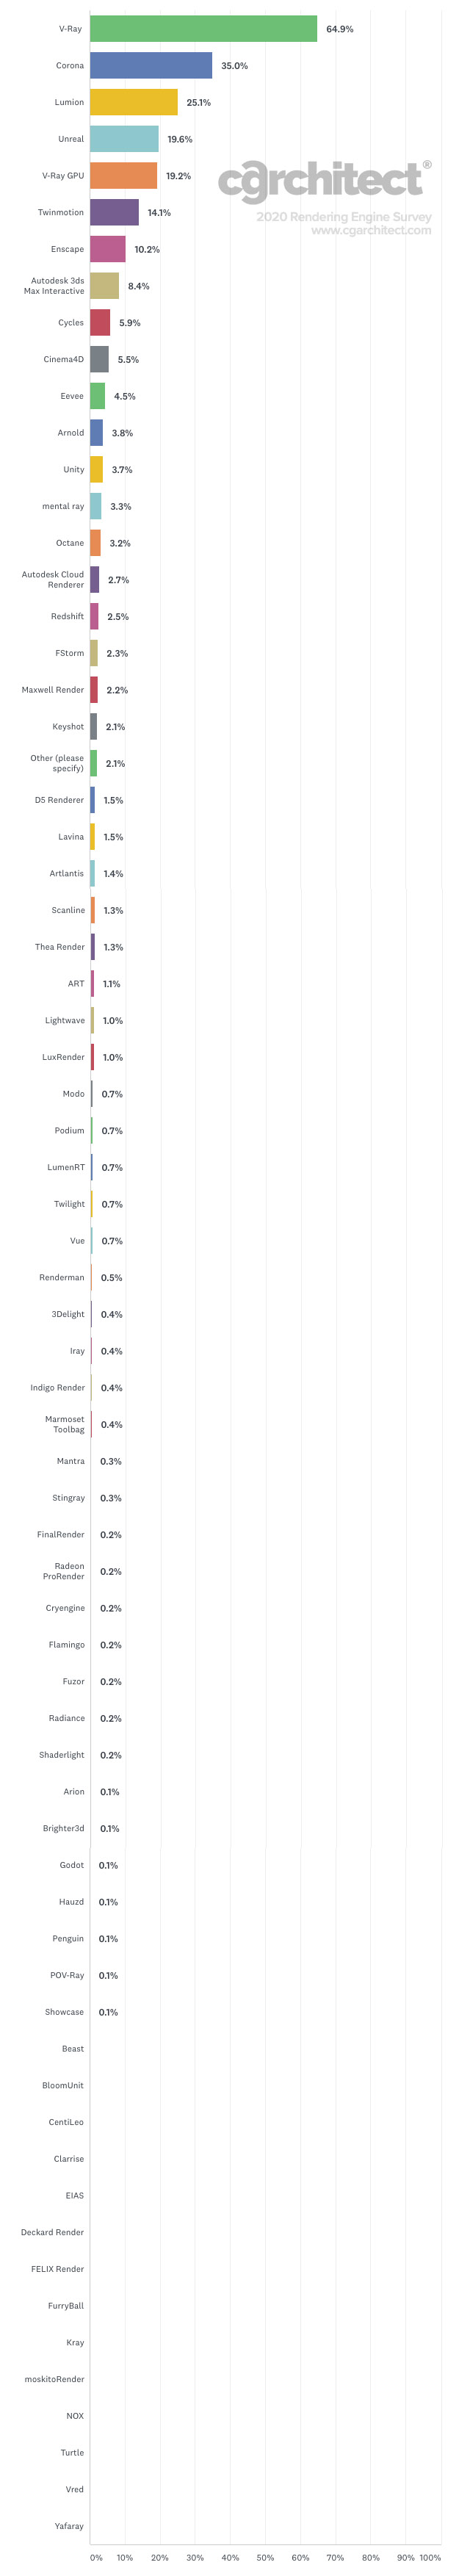
Which rendering engine(s) do you currently use in production?
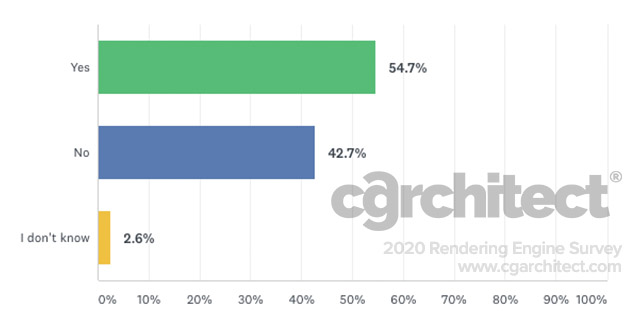
Are you currently experimenting with any additional rendering engines?
Which rendering engine(s) are you currently testing or experimenting with?
Margin of Error of +/- 3% with a Confidence Level of 95%

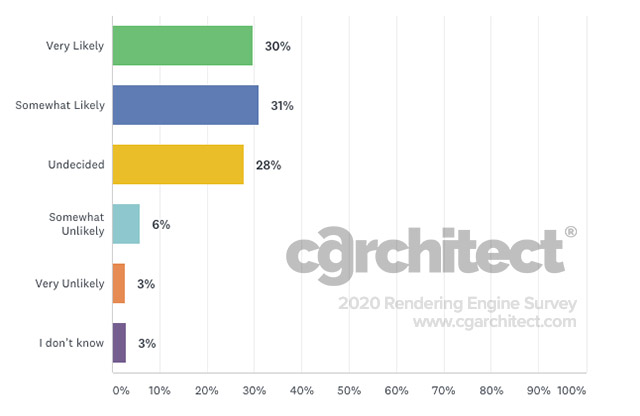
How likely are you to adopt the rendering engine(s) you are experimenting with, into production?
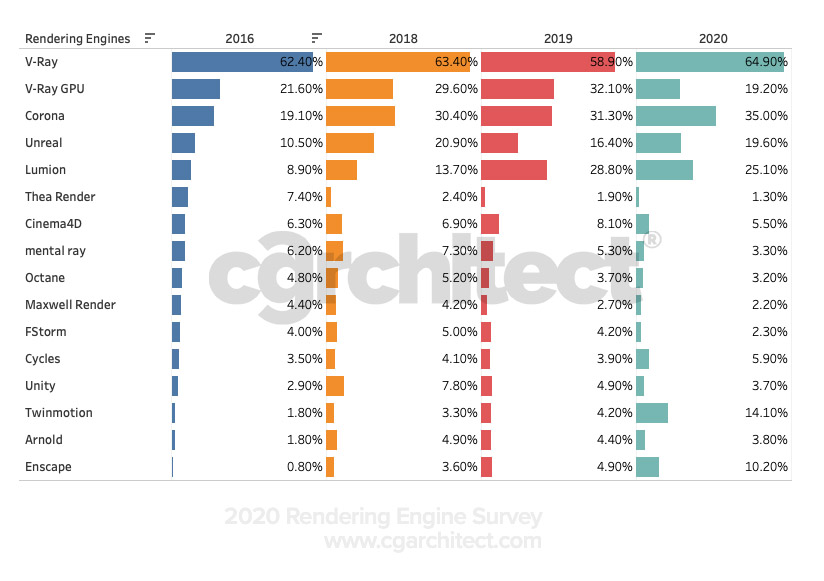
Top Rendering Engine Market Share Trends
This graphs shows the top rendering engines from our first survey in 2016 and how their industry market share has changed through to 2020.
You must be logged in to post a comment. Login here.
About this article
Results from the 2020 Rendering Engine Survey showing usage and adoption of various rendering engines in architectural visualization.
visibility12.1 k
favorite_border9
mode_comment2


I’ll be adding a comparison to the article soon
Hi Jeff, is there any easy way to compare the survey with previous years? Keep up the good work, the industry is very grateful!