


Industry Surveys
2021 Architectural Visualization Rendering Engine Survey Results
Image Credit: Vincenzo Sardone winner of the 2021 CGarchitect 3D Awards Student Image Category
The 2021 Architectural Visualization Rendering Survey is an update from our 2020 survey
The 2021 Architectural Visualization Rendering Survey is an update from our 2020 survey
Responses were gathered between August 24, 2021 and December 16, 2021 via CGarchitect’s community (social media & email newsletter) and through Facebook groups and software forums associated with real-time engines and architectural visualization. A total of 2,526 responses were received collectively through all channels.
For the purposes of Margin of Error calculations and market calculations, we are assuming a total market size of 150,000 people that are involved specifically in AEC visualization/rendering. Unless otherwise noted, the results have a Margin of Error of +/- 2% with a Confidence Level of 95%.
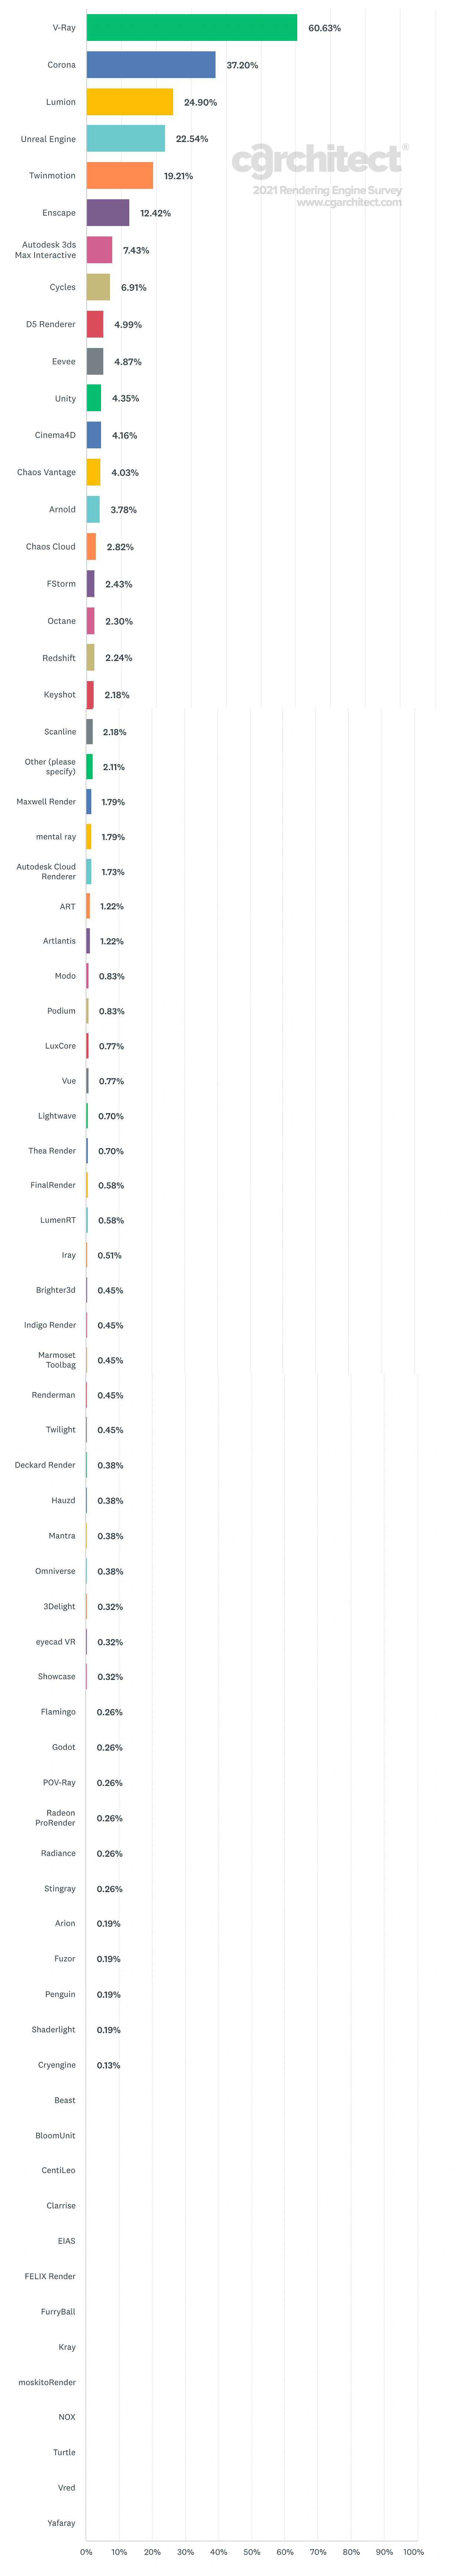
Which rendering engine(s) do you currently use in production?
Are you currently experimenting with any additional rendering engines?

Which rendering engine(s) are you currently testing or experimenting with?
Margin of Error of +/- 3% with a Confidence Level of 95%

How likely are you to adopt the rendering engine(s) you are experimenting with, into production?
Margin of Error of +/- 3% with a Confidence Level of 95%

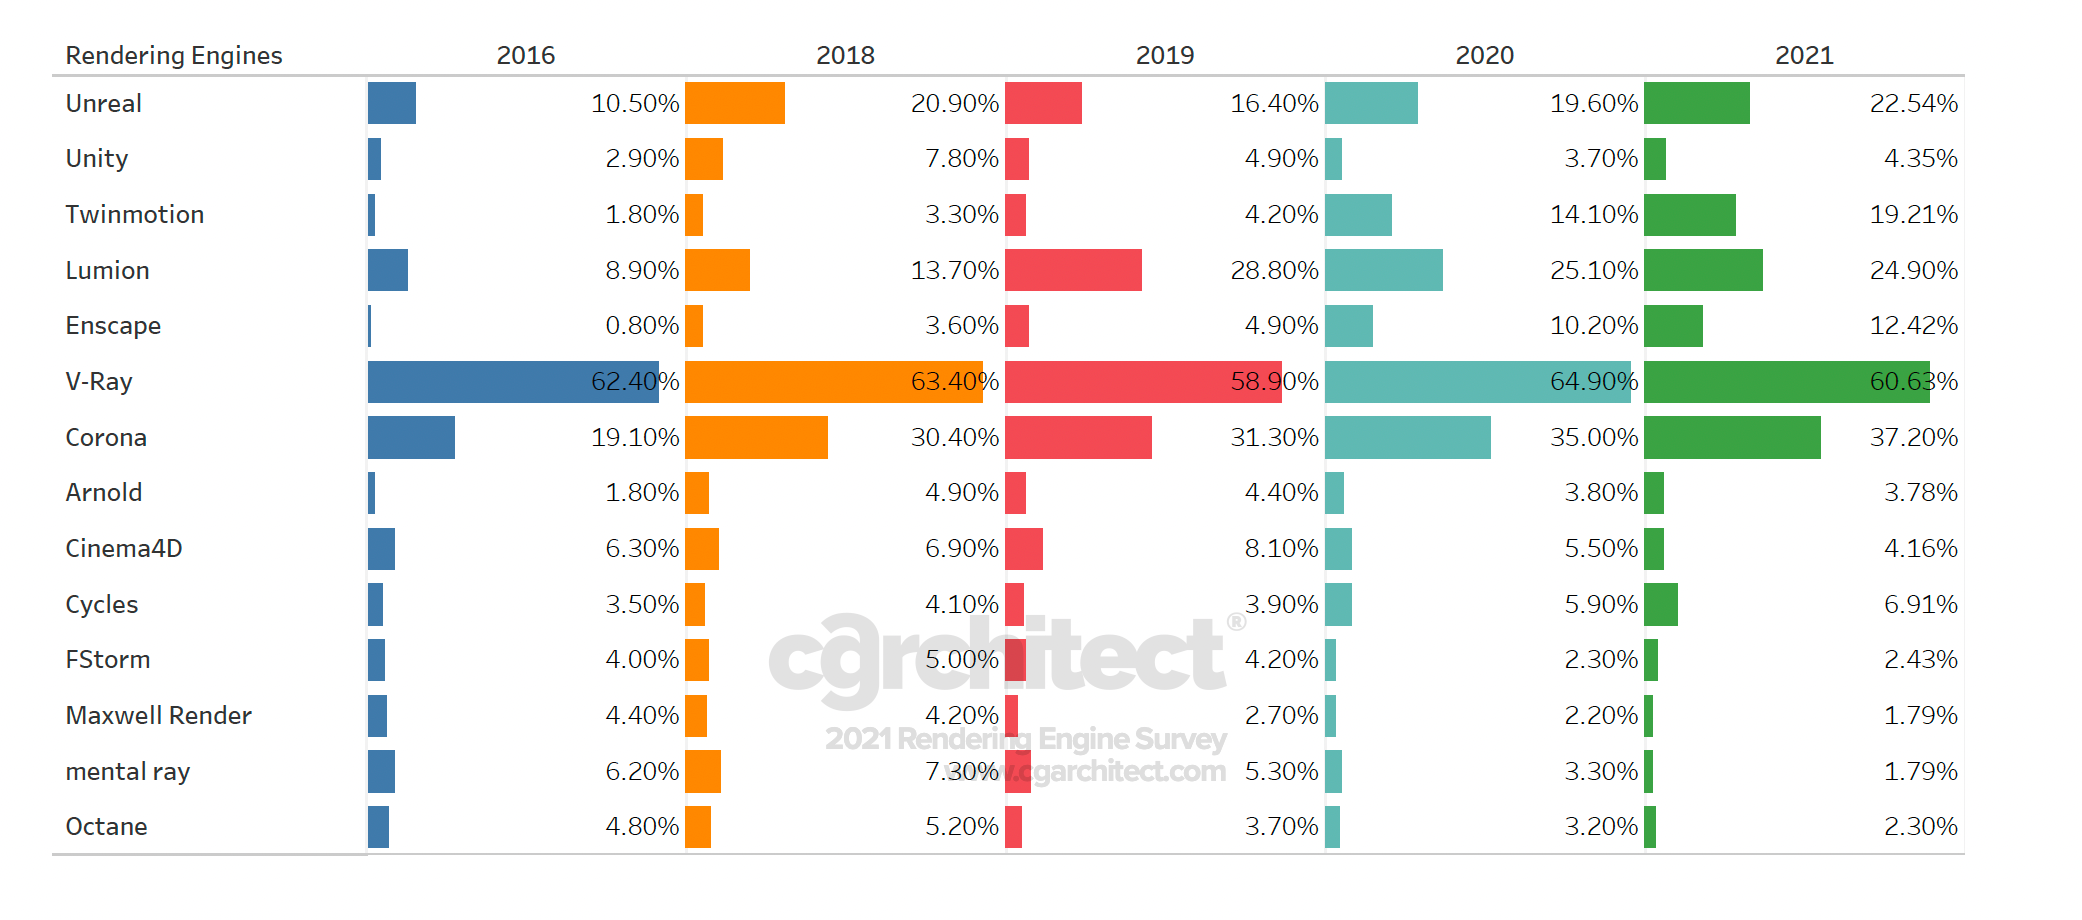
Top Rendering Engine Market Share Trends
This graph shows the top rendering engines from our first survey in 2016 and how their industry market share has changed through to 2021.
You must be logged in to post a comment. Login here.
About this article
Results from the 2021 Rendering Engine Survey show usage and adoption of various rendering engines in architectural visualization.
visibility8.53 k
favorite_border3
mode_comment1

Quite interesting results, especially the last graph with the year by year comparison.